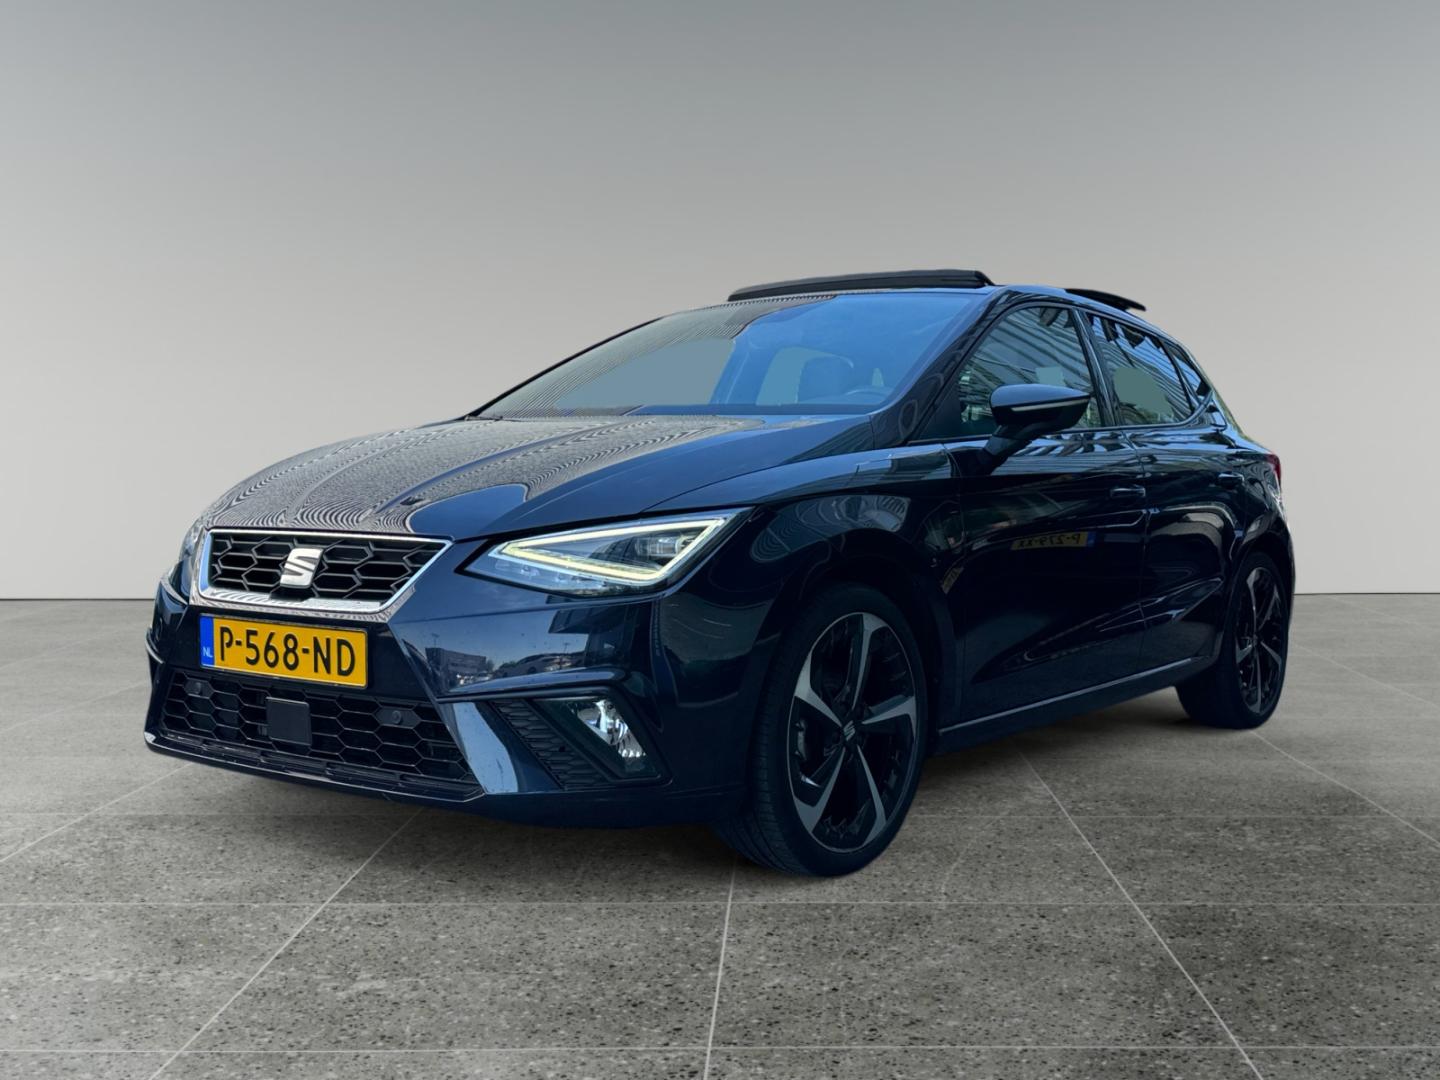
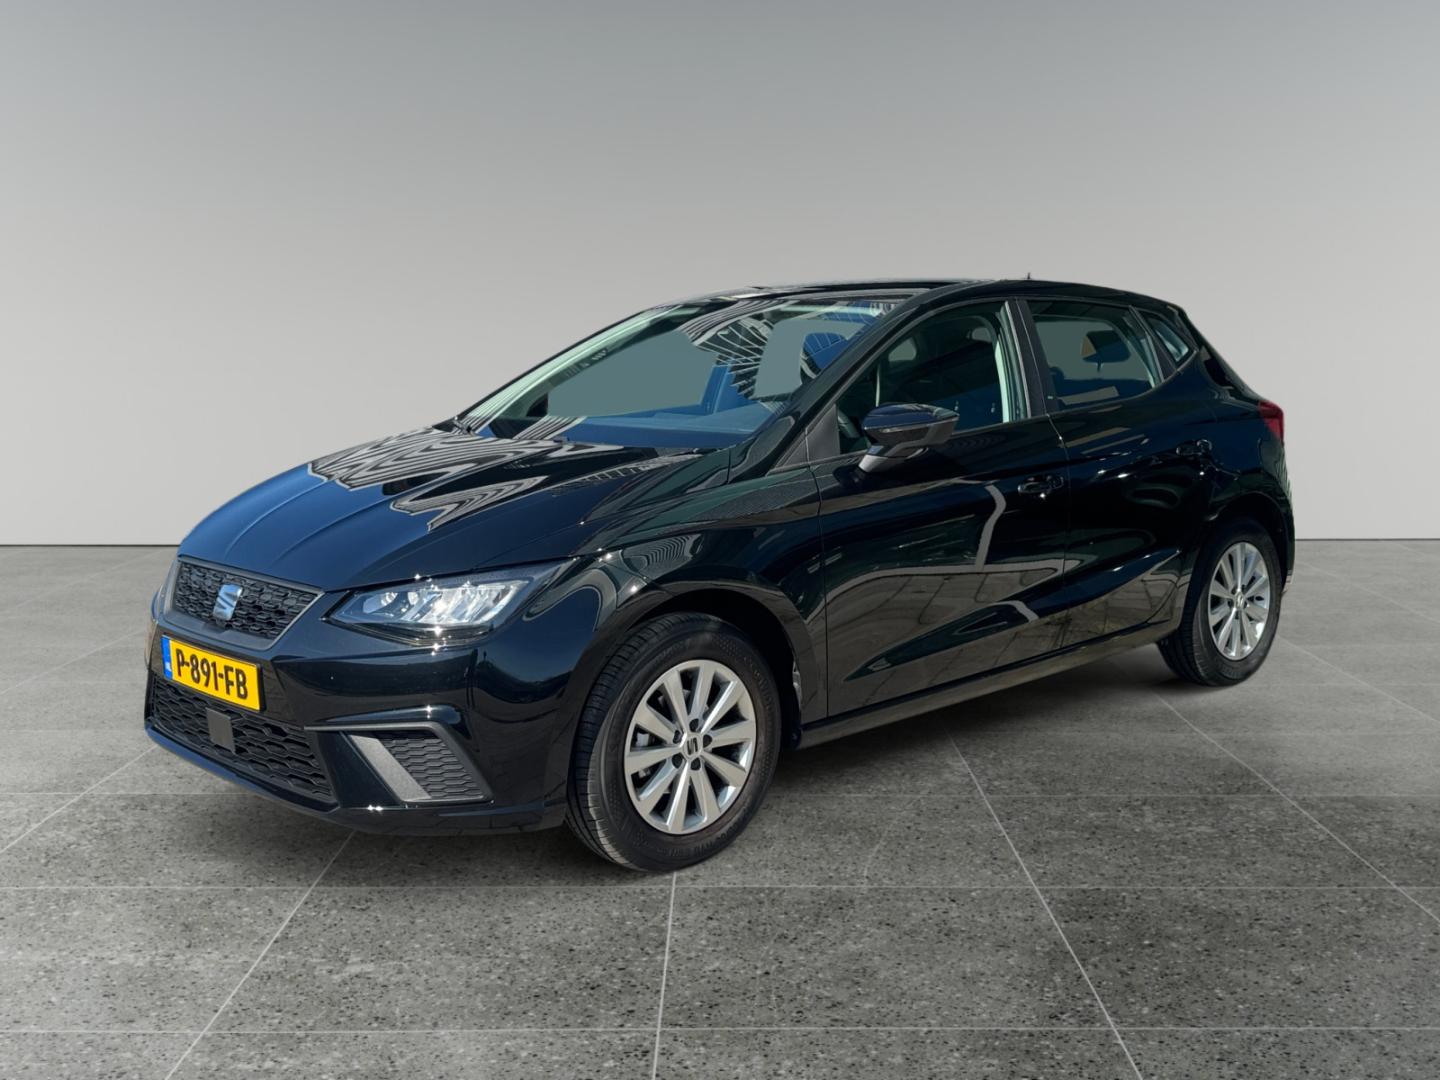
Depreciation year by year: SEAT Ibiza
A last-year SEAT Ibiza still asks 81% of its new price. After that it loses 2.3% a year on average. Measured on 185 cars for sale on 4 November 2026 (built 2015–2026).
Depreciation by year of the SEAT Ibiza| Year | Cars | Asking price | New price | Value kept | Drop per year | Mileage |
|---|
| 2026 | 28 | €24,850 | €27,300 | 91% | – | 10,000 km |
|---|
| 2025 | 36 | €20,450 | €25,900 | 81% | −10.7% | 18,000 km |
|---|
| 2024 | 51 | €16,750 | €25,400 | 70% | −14% | 33,000 km |
|---|
| 2023 | 31 | €15,950 | €25,350 | 63% | −9.6% | 55,000 km |
|---|
| 2022 | 17 | €15,450 | €23,300 | 64% | +2.6% | 58,500 km |
|---|
| 2021 | 8 | €15,700 | €23,250 | 70% | +7.9% | 60,500 km |
|---|
| 2020 | 8 | €16,200 | €23,300 | 68% | −2.3% | 66,500 km |
|---|
| 2019* | 3 | €12,900 | €20,500 | 66% | −3.2% | 58,000 km |
|---|
| 2015* | 3 | €9,950 | €18,150 | 60% | −2.4%a year vs 2019 | 73,500 km |
|---|
Median per year. New price: what the car cost new in the Netherlands, the RDW catalogue price (incl. VAT, BPM and factory options, without delivery costs). For cars imported used: the Dutch catalogue price of that version. Value kept: asking price divided by the car’s own new price. Drop per year: value kept against the next newer year; a plus means that year asks relatively more. Older cars have more miles, which is part of the drop. * Fewer than 5 cars: indicative only. Asking prices, not sale prices.